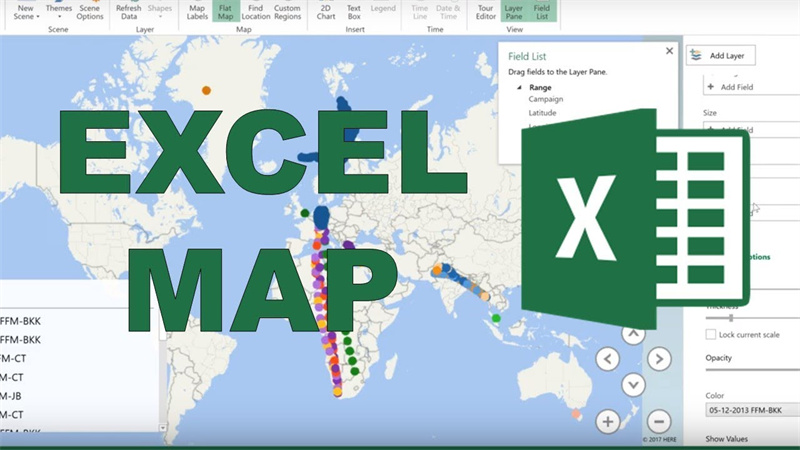
How to Use Your Excel Data Points to Develop an Interactive Map
Many mapping tools are complicated and cumbersome, not to mention expensive. Look for a mapping solution that combines the essential aspects of mapping without charging astronomical fees. Maptive is third-party software that integrates Excel mapping components to make data visualization fast and straightforward. The mapping software allows users to upload their location data and create a Google map within minutes. All addresses on the Google map will upload to the platform directly from the excel file.
Four steps to Create a Map from Your Excel Data
Here’s how to create a map using Excel spreadsheet data, often within minutes of starting.
Create your free trial account or log in to the software
Many mapping programs will offer a free trial period for the software, allowing full access to the program without a financial investment. Look for mapping software that doesn’t require credit card details at sign-up to ensure it’s free to use.
Select the “Create Your First Map” Icon
On the main dashboard, choose the option to build your first map. Give your map a name and select continue when you’re ready to start.
Upload Your Spreadsheet to the Platform
If the mapping software you’ve chosen allows automatic upload, you’ll be able to integrate all spreadsheet data automatically. Alternatively, users can use API to connect the data directly to the map for real-time updates. If the software allows Google Spreadsheet data, connect the two accounts for instant updates reflecting on your map. Alternatively, start with a blank map and add the locations manually, one at a time.
Choose the Columns to Use Within the Map
Most columns of data will automatically match to the mapping software, allowing users to confirm the information instead of manually entering it into the system. Once the initial map is created, the customization tools will help you uncover hidden details within your data that may have gone unnoticed. Share the maps, save them for future reference, or continuously update them with new details. If you want to stand out, embed the map directly to your company’s website. The options are endless with integrated mapping software.
What Can Mapping Software Maps Do?
Many mapping programs offer hundreds of features allowing businesses to view data in a completely new way. There are extensive mapping options, depending on your mapping goals.
Heat Map Data
Generating a heat map based on geographic data will add weight to your maps that spreadsheets can’t match. You can add different insights into the details, whether you want to track sales or clients. Results will display darker colors for higher density and lighter where there is less.
Group Your Spreadsheets on a Map
Choose a column in your Excel data to which you’d like to attach new values in the map. The mapping software should be able to automatically uncover all unique values and display them as a unique color within the map.
Map Zip Codes Through Your Data
As a boundary tool, US zip code maps can display the various borders across approximately 43,000 zip codes within the United States. Within moments of uploading your data, users can include comprehensive insight (whether it’s the latest census data or other demographics), connecting you to what matters most—your customers. After all, the more you know about your customer, the more your business will improve.

